

The first step to take as a trader is to trade the global market. As you gain more experience, you will discover that pattern identification is crucial to success. Speaking of patterns, one which you will often hear of is the butterfly pattern. This pattern has popularly been linked with chart reading and is helpful today.
Although other harmonic charts patterns like the crab, bat and shark patterns exist, the butterfly pattern stands out. We shall focus on a complete breakdown of this pattern and what traders should do when it appears on the price chart.
Start from $10, earn to $1000
Breakdown of the butterfly pattern
The butterfly pattern is a reversal pattern that has four legs. It is usually marked AB, XA, CD, and BC for identification and interpretation. This pattern helps traders to identify when a price movement ends. With the butterfly pattern, you can open a market position when the price reverses.
The butterfly patterns come in two variations; the bearish and bullish versions. The bearish butterfly pattern allows traders to sell, while the bullish pattern allows you to buy. When dealing with butterfly patterns, precision is vital, as it helps to eliminate any form of mistake.
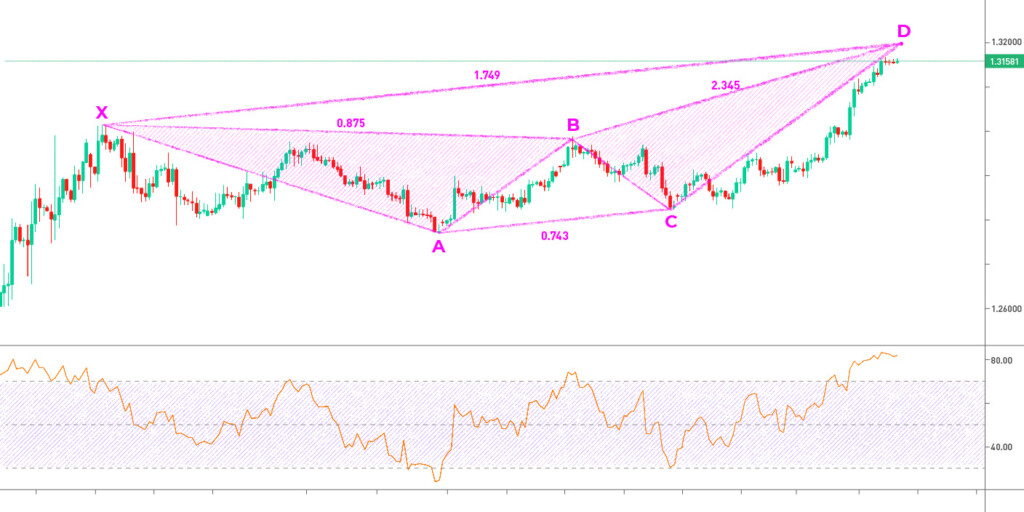
Below is a chart representing a bearish butterfly pattern forming on the GBP/USD price chart. Take note of the bearish affirmation by the RSI indicator below the chart, showing overbought levels.
Effective strategies in your mailbox
Subscribe and discover a fund of trading knowledge
Great! Please check your email
We’ve sent you an email to confirm your subscription
Something went wrong
Try reloading the page. If that doesn’t help, please try again later
How do I identify the Butterfly pattern?

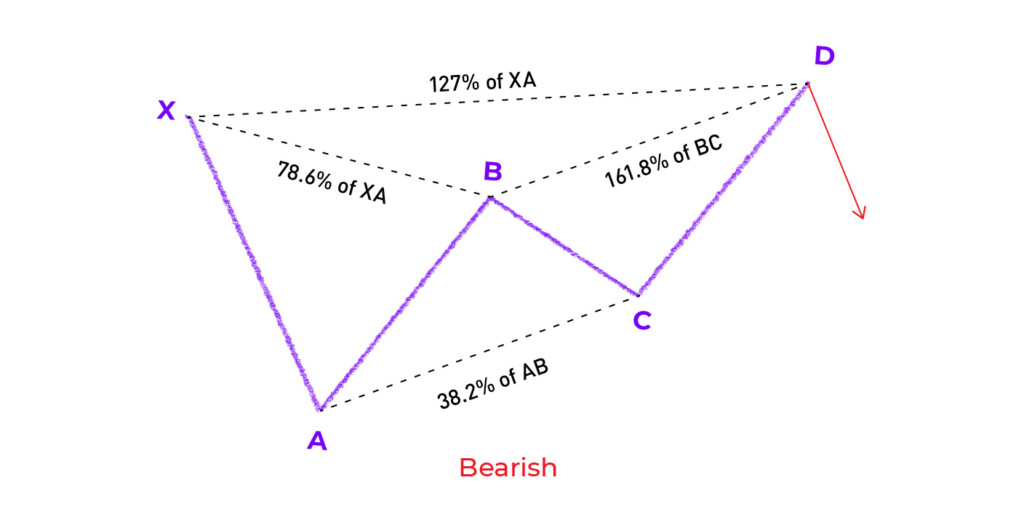
The butterfly pattern has four legs: A-B, X-A, C-D, and B-C. The pattern informs traders when it is right to sell after fully forming.
The X-A leg is formed when there is a sharp fall in price from point X to A. The A-B leg takes note of a switch in the direction of the market price and retraces 78% of the X-A distance. The B-C leg notices another change in the price direction, retracing up to 88% of the A-B distance. The C-D leg expands to form a 161% extension of the A-B leg, making it the most significant part of the butterfly pattern.
The butterfly pattern can easily be misunderstood as a double top or bottom pattern. When the price is in a downtrend, it assumes the letter “M” shape, while it looks like the letter “W” when the price moves in an uptrend.
What to do when you spot a butterfly pattern
The first thing to do when you identify a butterfly pattern on the price chart is to validate your discovery. Refrain from following the urge to open a position immediately. A few checklists ensure the pattern formed is a butterfly and not something else.
Earn profit in 1 minute
It should have the following vital elements:
1. B-C element
It should have a minimum of 38.2 % and 88.6 % maximum Fibonacci retracement of the AB leg.
2. A-B element
Should be a suitable target of 78.6 % of XA leg
3. C-D element
This target falls between 1.62 to 2.62 % Fibonacci extension of the AB leg and 1.27 to 1.62 of the X-A leg.
Trader’s level test
Answer 7 short questions and define your level as a trader. Take the test now to evaluate your real knowledge!
Start test

Applying the concept
Now that you have validated the authenticity of the butterfly pattern, you can proceed to trade it. Finding a good entry point is one thing to start with. Determine where the pattern will complete at point D. This is usually at the extension of the X-A leg.
The stop-loss location must be below the 161.8 % Fibonacci extension of the X-A leg, while the take-profit location depends on your trading goal and the market condition. An all-out profit target will have its take profit at point A of the pattern, while a conservative target will have it at point B.
Concluding remarks
Whether you are a novice or a professional investor, patterns’ effectiveness as a trading tool should not be underestimated. When indicating a trend reversal or continuation, the butterfly patterns play a pivotal role. Also, in identifying exit and entry points from an open position, a good understanding of this pattern would be a plus to your trading skill. When deployed effectively, the butterfly pattern can help predict price action in the future, making it an indispensable trading tool.
Trading with up to 90% profit
<span>Like</span>